Automated reports and insights that improve business performance by joining your data across any sources.
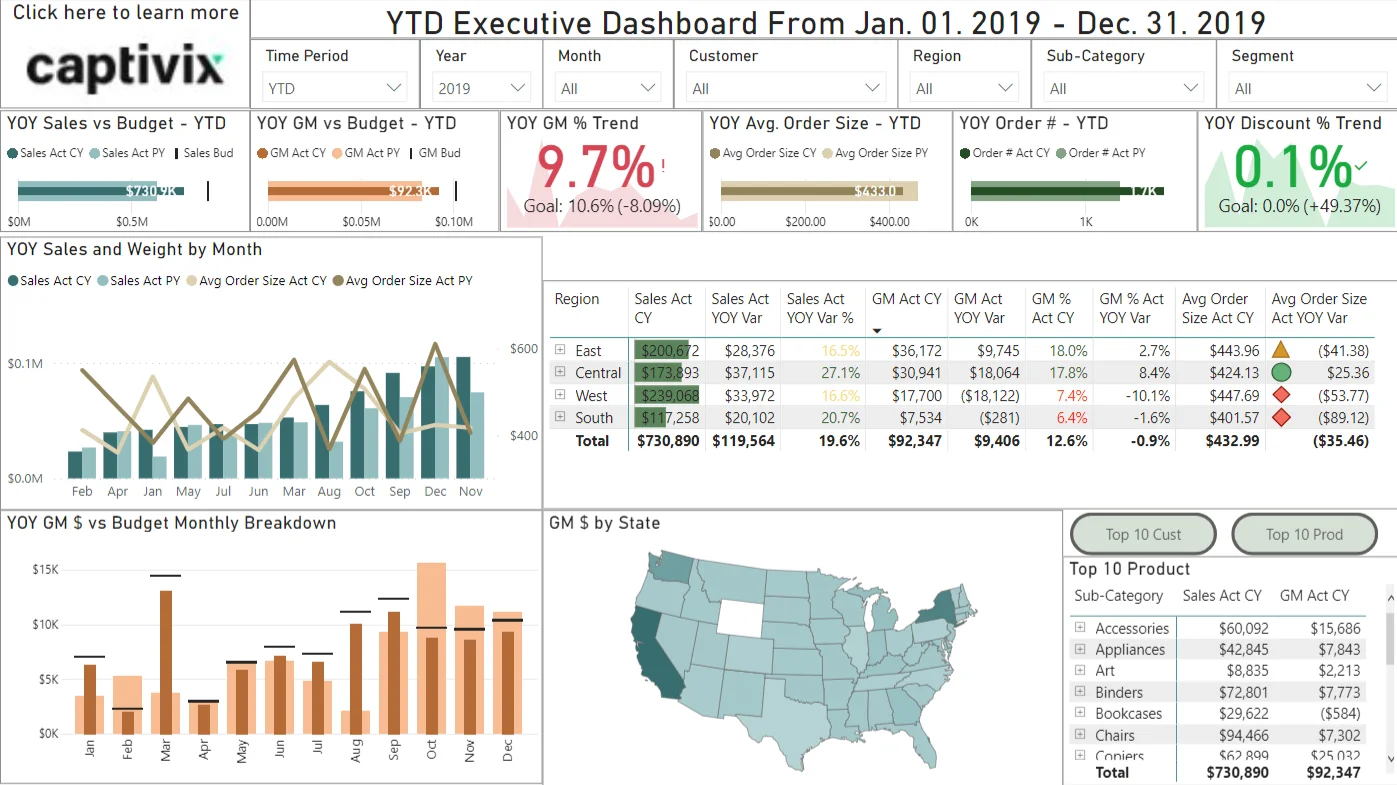
Pre-built report collections that provide business insight on Day 1 of being live with Captivix Power BI Reporting.
Integration with any source system including ERP and other back office systems and databases.
Captivix Team work with your business IT department to build the best Power BI reporting dashboards.
We offer consultation on how things would benefit your business and provide training post-implementation.
Collect and store enterprise-wide data for one source of truth. Provide access to authorized personnel for accurate reporting.
Integrated ecom environment, API/microservices-based development, and Highly scalable cloud-based solution.
KPIs for the data-driven decision-making your management teams require. Use predictive historical data for specific reporting needs.
So that you can focus on making decisions and prepare your business with all futuristic and dynamic requirments.
Captivix assists your business in converting data into usable information that creates the comprehensive analytics required for today’s competitive, data-driven organization in the best possible framework.
Buy Captivix’s pre-built BI reporting Solution dashboard and get your live business report immediately. With Simple drag and drop builder, you can produce more reports. Don’t waste time building comparable BI reporting Solutions that may take 1+ years to build, investing lakhs of dollars. Talk to our Reporting experts to start today.
Eliminate random spreadsheet errors with an automated reporting solution with power BI that refreshes itself to give live information from your data through other connected systems. Grant access to power BI reports with the license that we provide. With automated reporting, you eliminate your spreadsheet errors in information.
Forcast business needs and solve problems in your business with decision-making that is backed by data and information. Get answers to questions like Sales Order Profitability, Cash Flow Forecasting, Inventory Forecasting, Predictive Analytics, Multi-Currency Reporting, Revenue Management Reporting, and more.
We recently worked with Bev analytics, a Chicago-based organization that specializes in analytics for the beverage industry to drive brand recognition and increase sales. We offered them a friendly reporting dashboard while digitizing their infrastructure with our custom development solutions, Data analysis using ML technologies, and mobile app. With many sources to collect data, our power BI dashboard is helping them to make better business decisions.
Power BI is a suite of business analytics tools to analyze data and share insights. It includes a desktop application, a cloud-based service, and mobile app.
Power BI allows users to connect to, visualize, and analyze data with a variety of tools and features. Users can create interactive dashboards and reports using data from a wide range of sources, including Excel, SQL databases, and cloud services.
Power BI offers a variety of features for data visualization and analysis, including:
Power BI offers a free version and a paid version with additional features. The free version includes basic features for data visualization and analysis, while the paid version includes additional features such as data governance, data protection, and advanced analytics.
Yes, Power BI can be integrated with a wide range of applications and services, including Excel, SharePoint, and various cloud services.
Yes, Power BI is suitable for small businesses as well as larger enterprises. The free version of Power BI includes basic features that may be sufficient for small businesses, and the paid version can be customized to fit the needs of a small business.
Fill out the form and our Power BI experts will reach you within 24 hours. A complete complementary audit and support is awaiting.